Surely you have already tried tools that analyze the behavior of your users such as Hotjar, Mouseflow … But have you heard of Microsoft Clarity?
Last October 2020, Microsoft launched a tool on the market that allows us to analyze user behavior and help us understand how the user interacts with our website.
Although it is true that there are several alternatives on the market, normally in order to obtain functionalities of interest we have to access payment plans. Microsoft seems to have noticed this, and so Microsoft Clarity was launched, a totally free tool that has not gone unnoticed.
Table of Contents
What does Microsoft Clarity offer?
This tool gives us access to:
- Heat maps
- Session recordings
- Insights through an informative dashboard
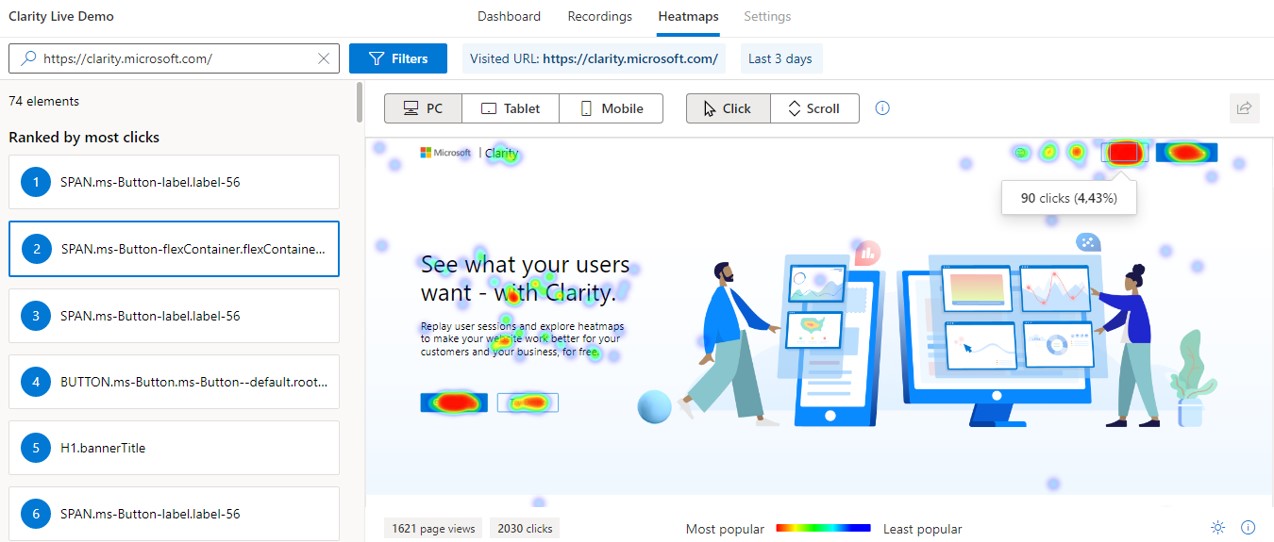
Heat maps
For those of you who have landed here for the first time and still do not know what we are talking about, we will explain it to you below.
Heat maps allow you to see which areas of your digital assets the user clicked on, rating them in hot areas (where there have been more interactions by the user group) and cold areas (where there is less interest and the user hardly interacts).
Well, this allows us to analyze problems associated with the user experience that we need to solve.
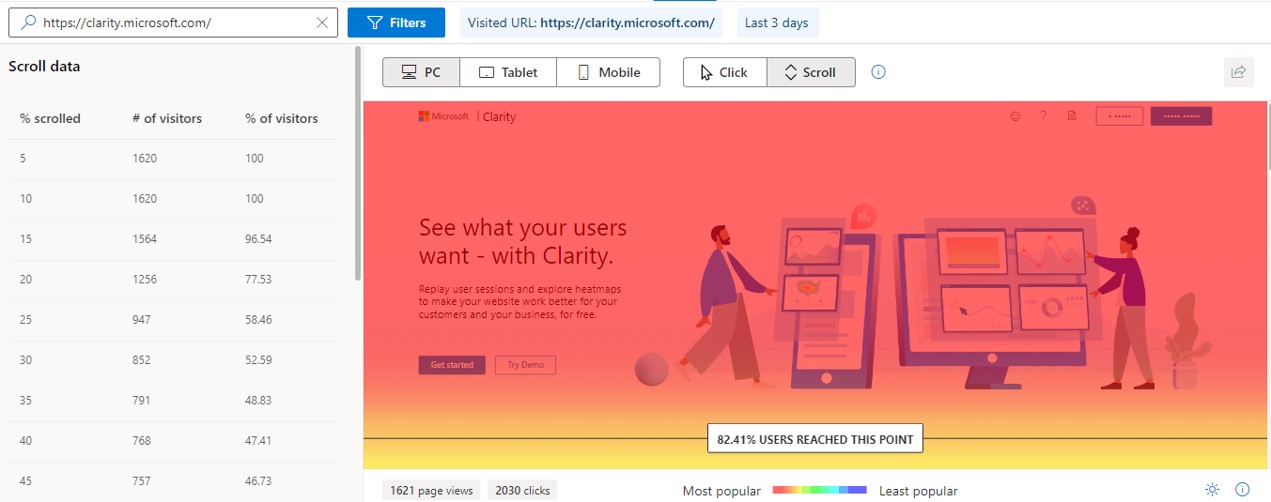
Scroll tracking
This type of heat map indicates the scroll rate that our users have made on the different pages of our site. With this we can, for example, detect if the content we offer is of quality and our user reaches the end or leaves too soon.
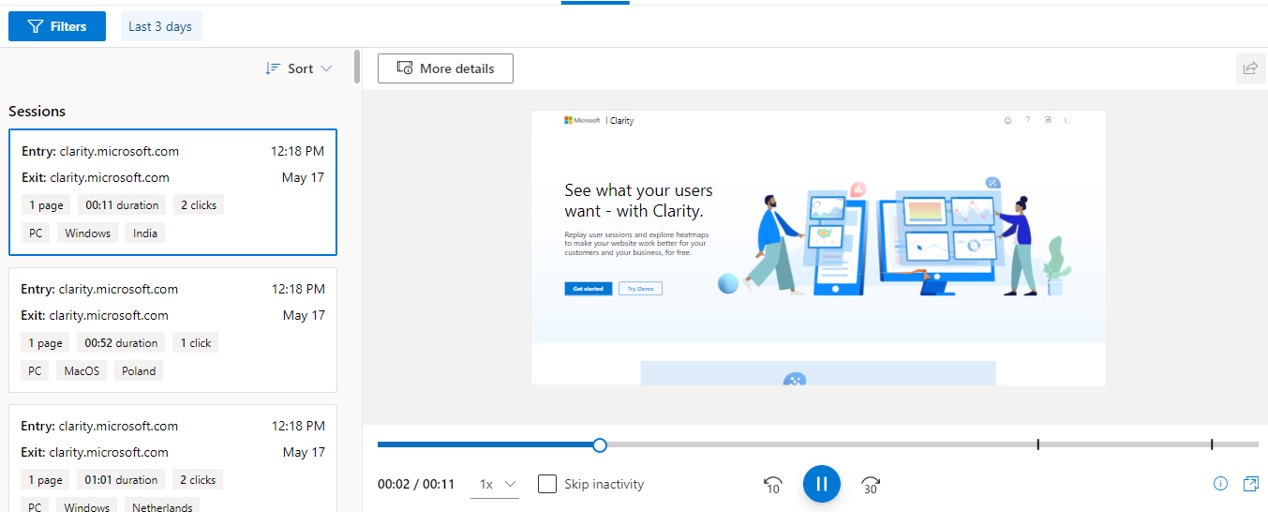
Session recordings
This functionality allows us to record user navigation to detect weak points, lack of compression, errors, etc.
The tool masks sensitive data, and lets you choose up to 3 types of masking in its configuration, in addition to blocking IPs.
Microsoft provides us with metrics such as rage clicks (or angry clicks), which are those clicks that the user makes very quickly and successively on a page, or JavaScript errors. This provides us with useful information to be able to address improvements and UX optimizations of our website.
Information panel
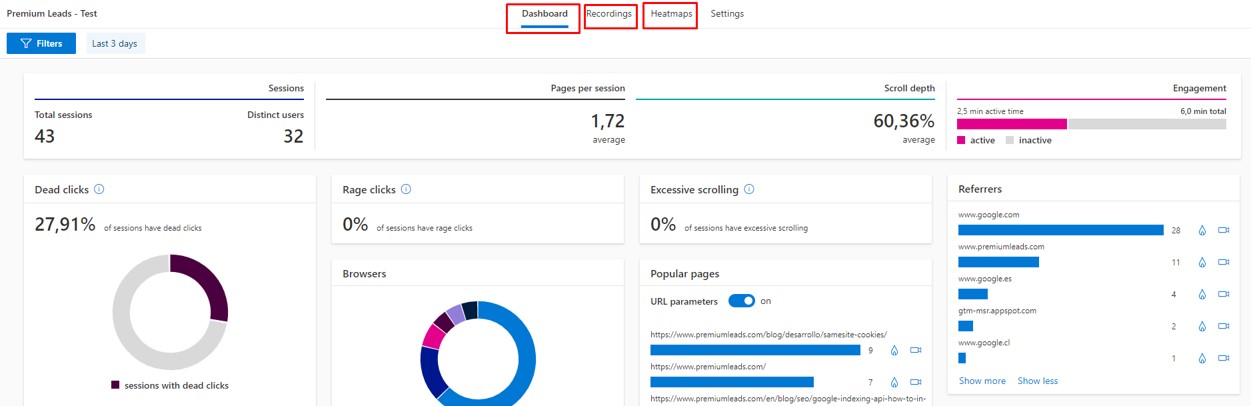
In this section, Microsoft has created a custom dashboard where we can, on the one hand, view and analyze the following metrics:
- Sessions
- Pages per session
- Scroll depth
- Engagement
- Dead clicks (when the user clicks on an area or element with no effect)
- Rage clicks (when the user quickly clicks multiple times on an area or item)
- Referents
- Devices
- Browsers
- JavaScript errors
- Countries
- Operating systems
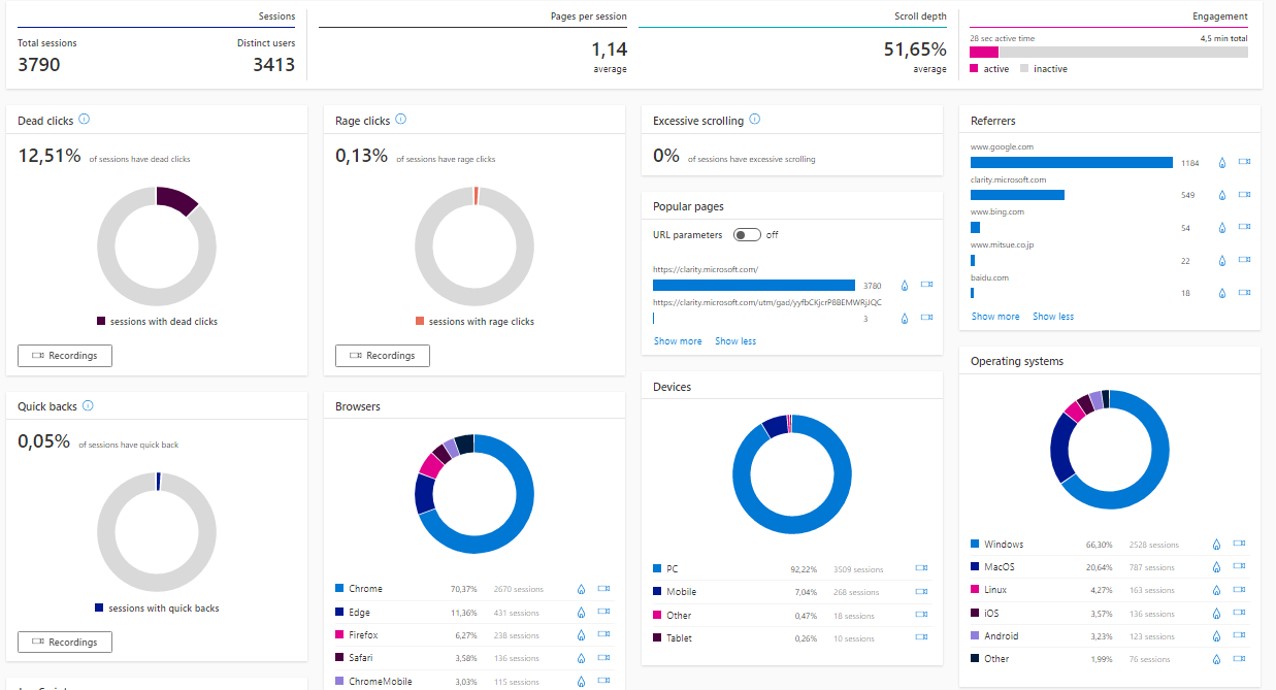
By clicking on the icons of each card, we can access the heat maps or recordings of that segmentation.
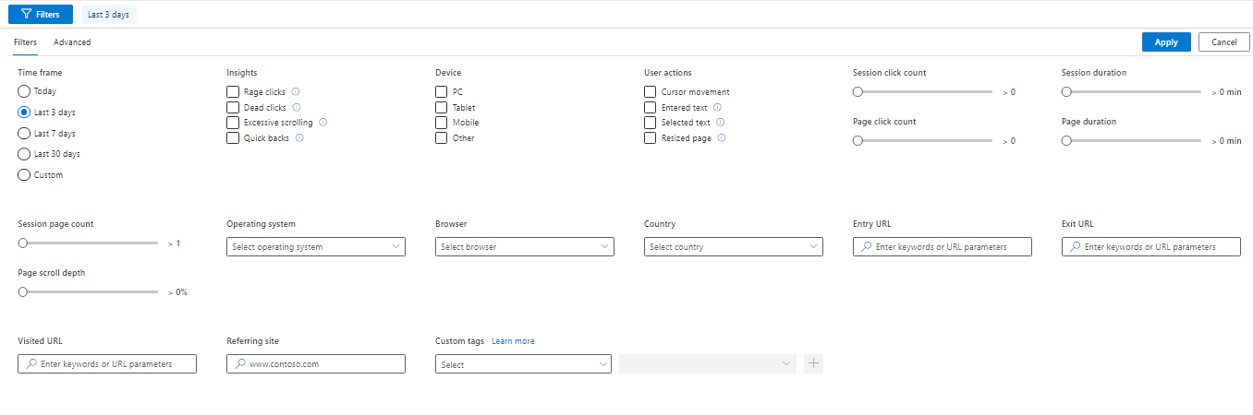
On the other hand, we can filter our data both by the options that it shows us by default (see filters), or by creating custom labels based on our business (creating custom labels), such as the checkout steps or objectives that we define, for example, a user record. In this way we can apply these filters in our recordings or heat maps, and segment users in a very simple way.
How to install a project in Clarity
- Register at https://clarity.microsoft.com/
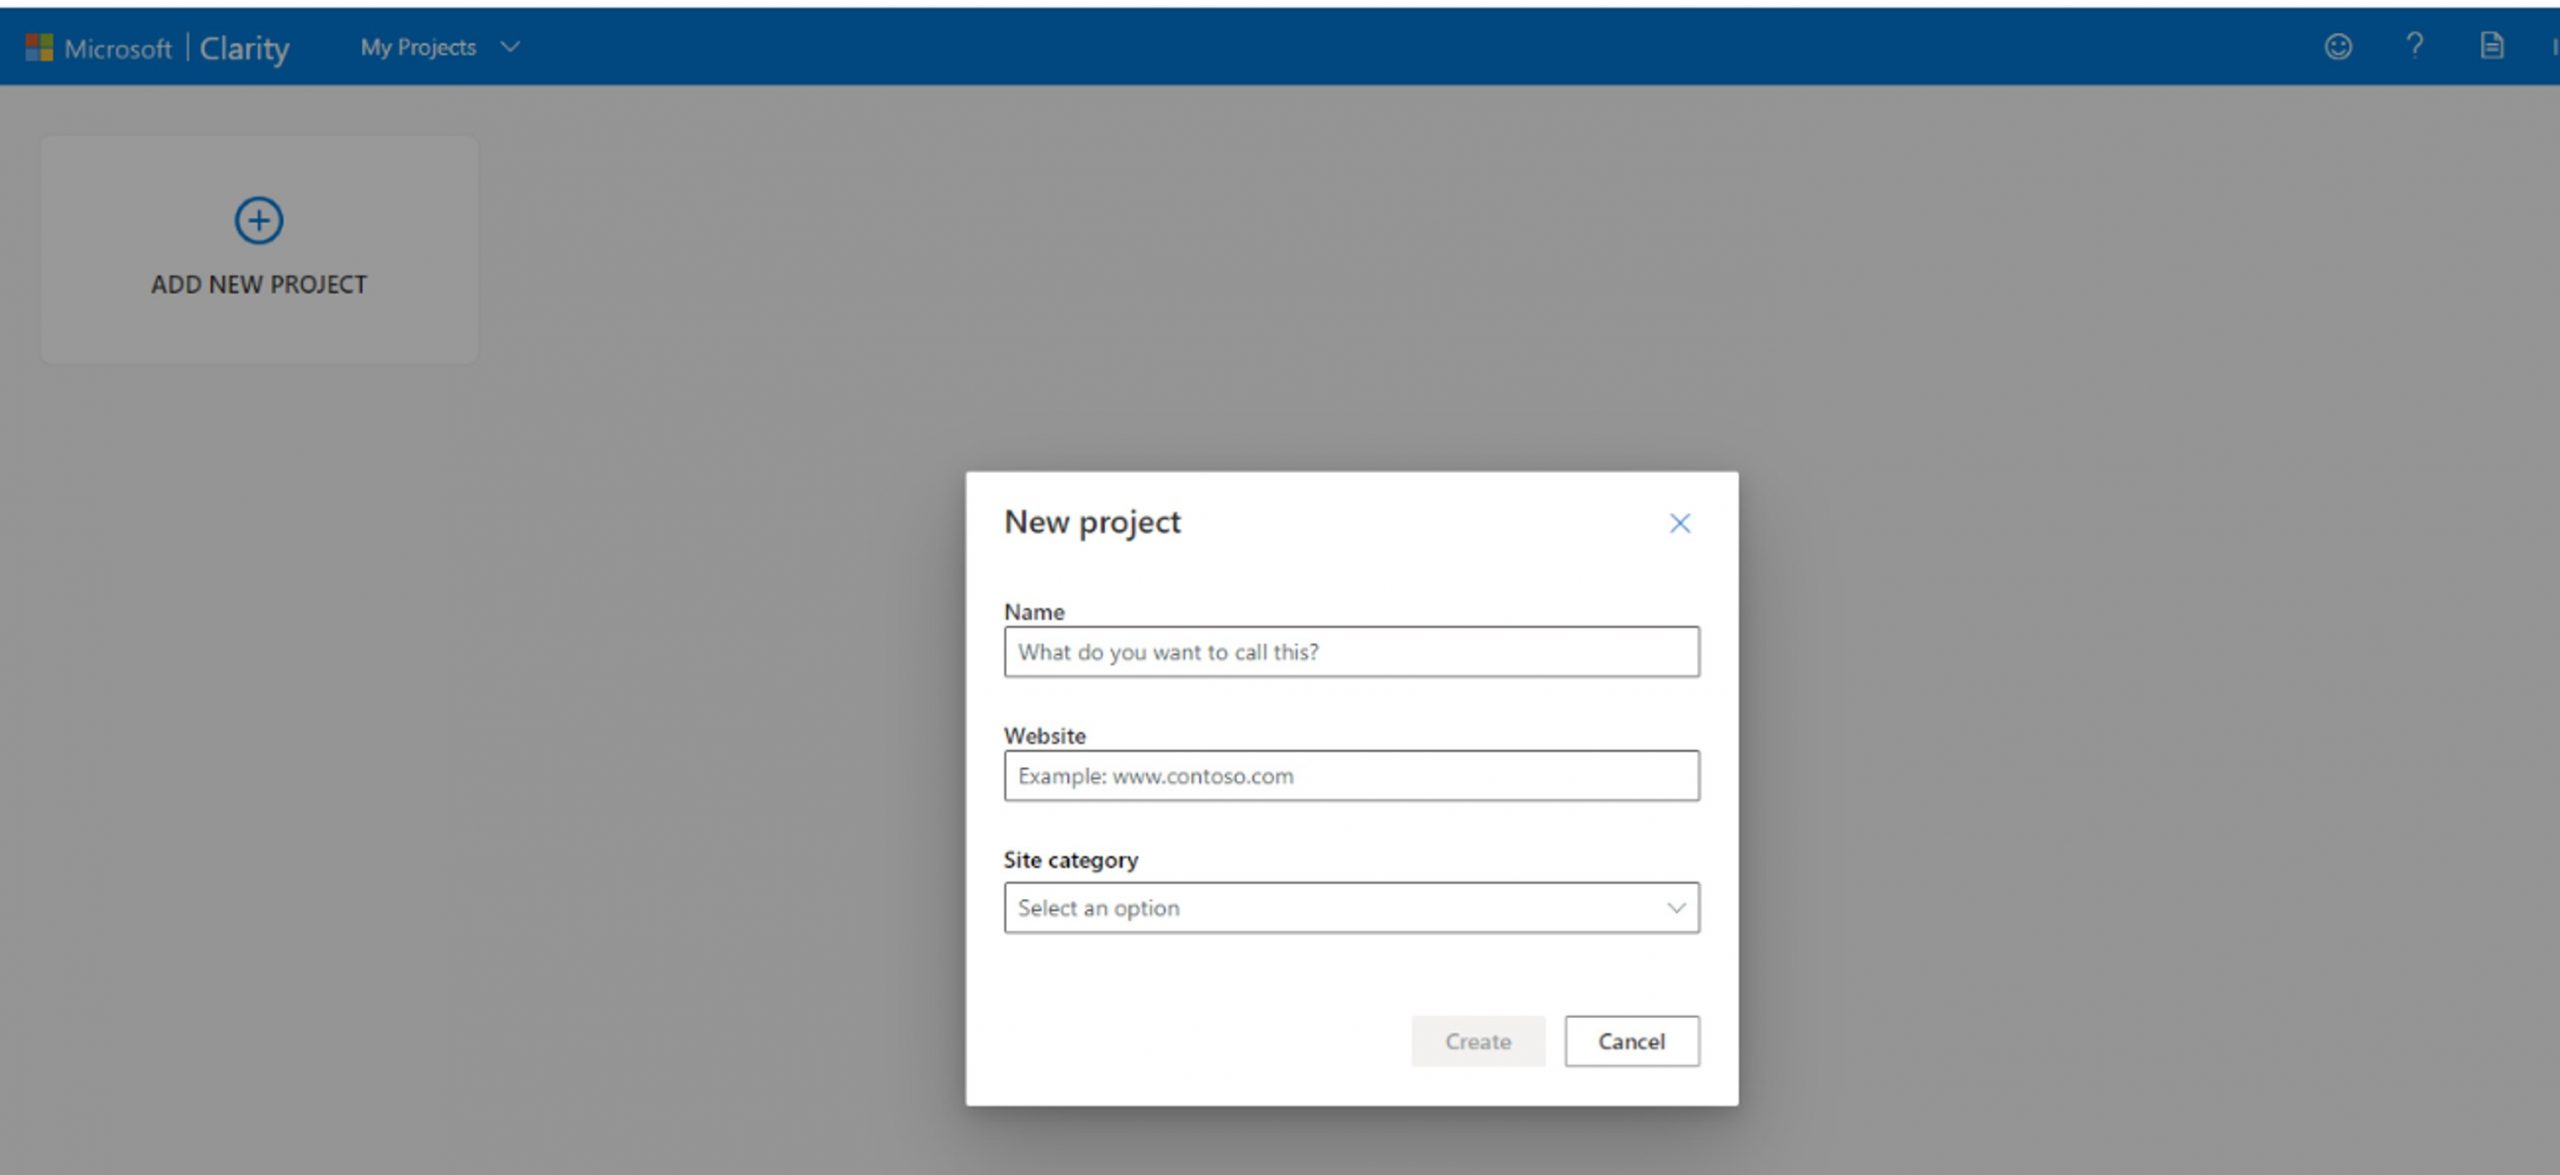
- Create a project
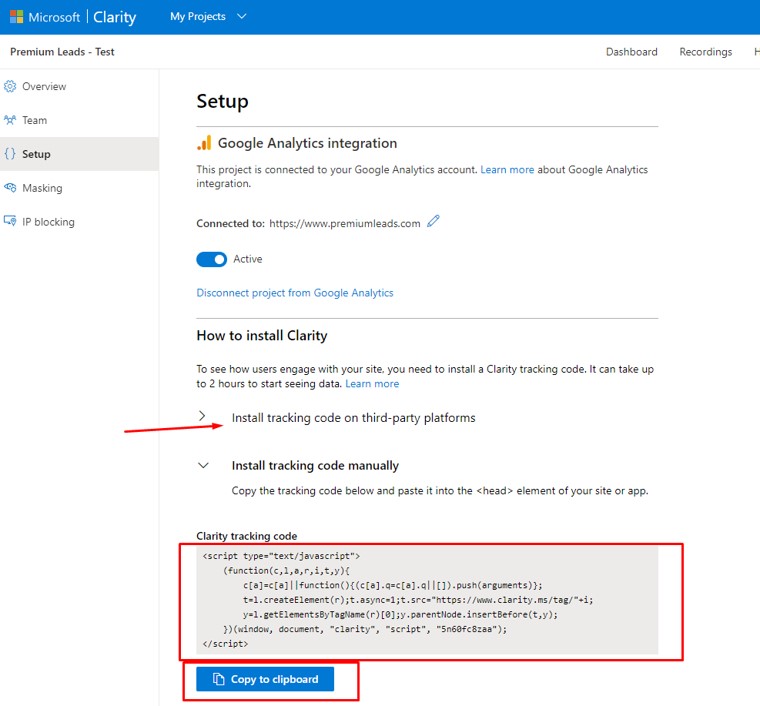
- Install the tracking code indicated in settings> setup and follow the specified steps, there are two ways:
a. Manually: by copying and pasting the code in the <head> of your website.
b. Using third-party tools such as Google Tag manager.
4. Start analyzing data
Why use Microsoft?
If you are still not sure about trying the tool, here are some strong points that we have found to be of real interest:
- It is a free tool
- Its implementation and use is very simple
- It is adapted to the GDPR and CCA
- By implementing the code, the entire website is already measured, there is no need to launch heat maps and session recordings separately
- Creation of 100,000 heat maps per page view
- Recording of 100,000 sessions per project and day
- Real-time data processing: once the tool code is implemented, you can see the data on your dashboard instantly
- Consultation of data from the last twelve months
- It does not use sampling
- Unlimited user access
Although we have found it to be a very advanced tool to be free, we have noticed some deficiency that Microsoft will surely work for the future, for example:
- It does not have funnel creation
- The information that appears on the panel cannot be downloaded
- It does not have mouse movement maps
- At the moment, there is no access to an API to connect the data
- Cannot apply regular expressions (it has already announced that it will be available soon)
- It does not have an extension to carry out user surveys
Integration with Google Analytics
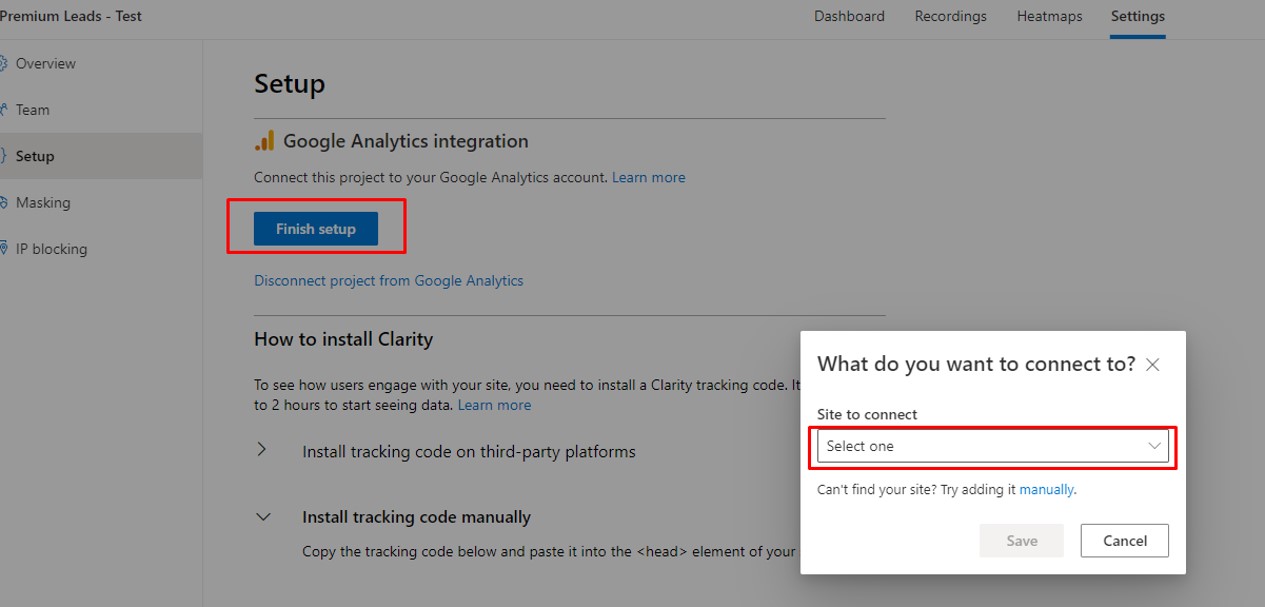
Microsoft Clarity also allows us to connect with Google Analytics in a very simple way. It will ask you for access to the property you want to connect:
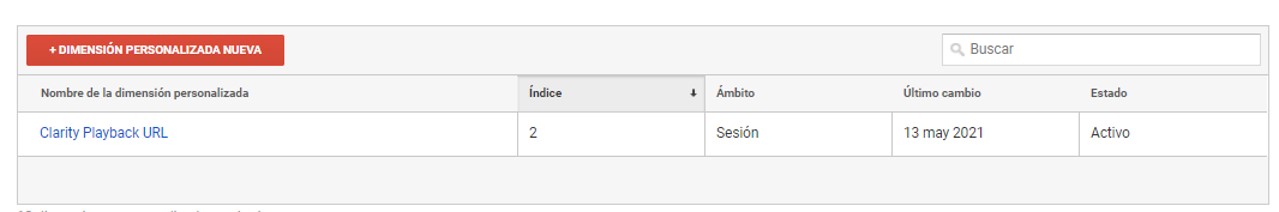
And what it will do is to create a session type custom dimension to send the recordings URLs:
You can also cross this information in your Google Analytics reports.
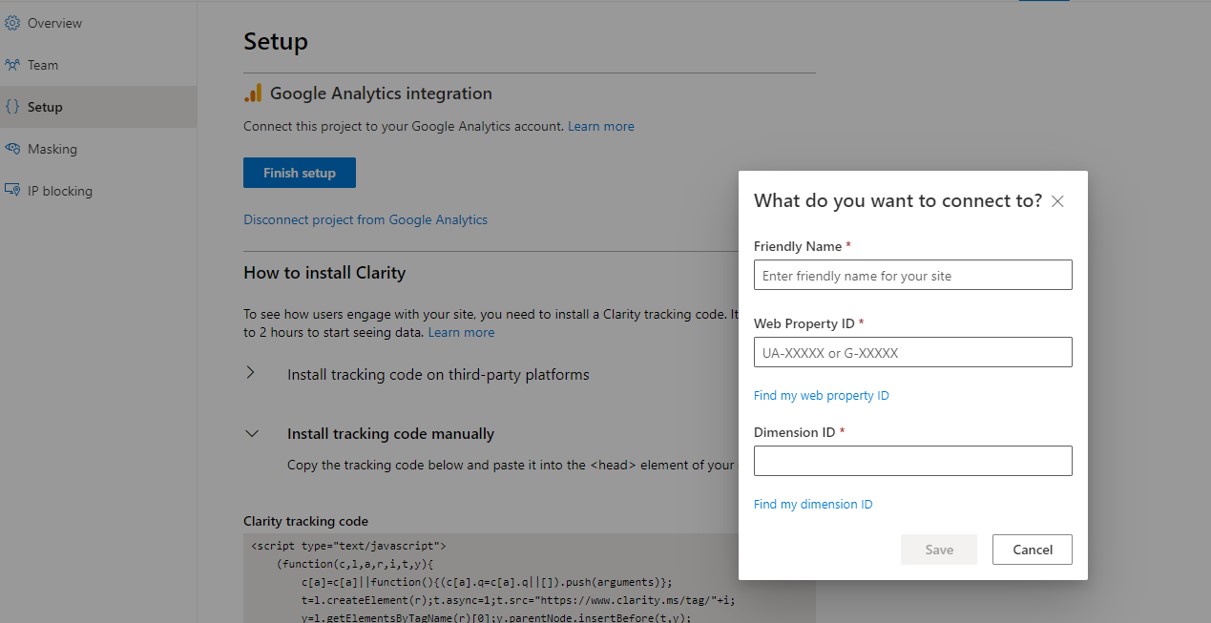
But if you are concerned about a dimension being created in an index, no problem. You can do the integration manually by selecting the manual link when opening the connection popup and the configuration will open:
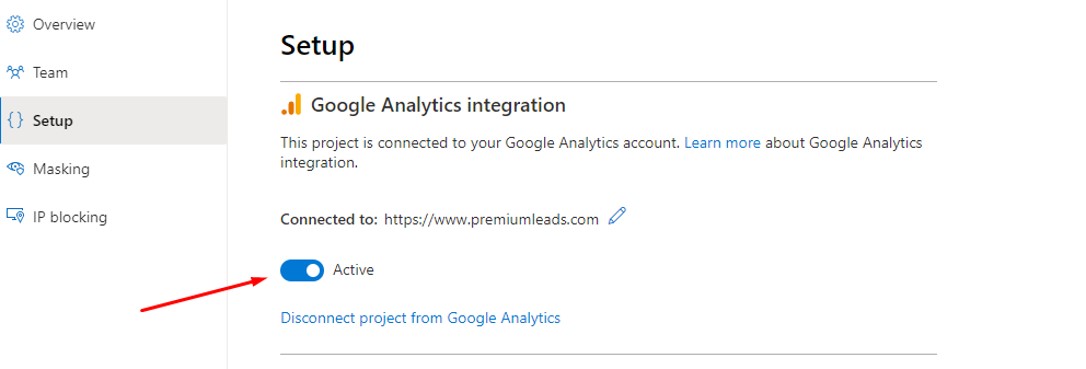
You can deactivate the integration whenever you want by simply deactivating it in the following button.
Conclusions
In our opinion, if your business is oriented towards blogs, lead capture, corporate pages, etc. It is possible that with a tool like Clarity, you can improve your business objectives since it offers, in addition to the basics, very interesting metrics that help analyze the behavior of your user.
If you already work with E-commerce or more complex businesses, you may need to invest in a payment tool with more features.
In the short term, this is a good option since it is developed by Microsoft and it is likely that in addition to improving it, perhaps it will somehow integrate it into its tools such as power BI (this is an idea that we leave here in case someone reads it ?) .