Data control filter
When to use it
When we design a generic dashboard, with metrics that can be common to different data sources, and we want the user to have access to all of them easily from the dashboard. For example, if I want to have on my Search Console dashboard all my properties data available.
How to use it
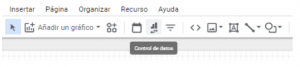
We must insert the object “Data control”:
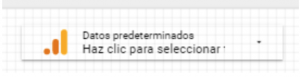
By clicking here, we will see how our dashboard automatically shows the following element, from which we can have access to all views in Google Analytics:
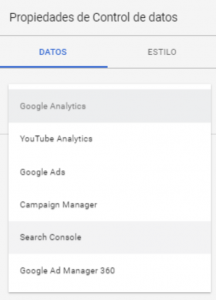
If we want to have access to other tools’ data, Search Console for example, by clicking on that element we can choose the tool we want among the following ones:
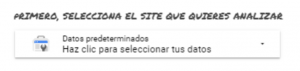
This way, we can filter by any Search Console property to which we have access from our user. In case we want to use this resource, we recommend to add a note that allows the user to know that they must previously choose a data source:
Report level filter
When to use it
When we are working with a dashboard that has different pages. By default, filters are applied to a whole page data, but when you change the page, you must apply those filters again.
How to use it
We select the filter, whichever the type, and by clicking on the right button we will go to “Report level”:
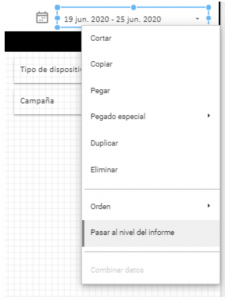
This way, this filter will automatically appear for all pages, so when the user changes the date in one of them, it will stay changed also in the rest of pages. Be aware that if you have already added a date filter in each page, by doing this you must delete all filter elements in each page, so they do not interfere with the report level filter.
Combining Data
When to use it
Whenever we want to calculate the relation, the percentage, between two types of data. This would normally be solved by creating a calculated field in our data source. However, sometimes this data belong to the same metric, but with different applied filters or segments. For example, if we want to show the percentage of users on our web that complete the buying process.
How to use it
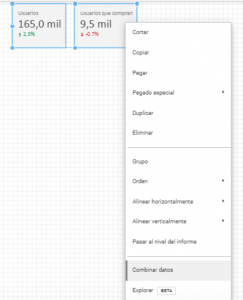
We could combine the data from “Users” and from “Users who buy” by choosing both metrics and clicking on the right button. From here we go to “Combine data”:
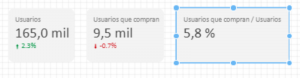
Automatically, we will see that a new card is created containing th percentage for “Users who buy”/”Users”, but without adding a new field in the data source:
Custom dimensions
When to use them
Wheneve we want to create a new variable from those we already have. For example, if I am working with Search Console data, I might be interested in combining the information I have in the “Keyword” variable by the number of words that keyword contains. This way I will know how to long-tail searches work. It would also be interesting to separate those keywords depending on if they do or they do not contain my brand, so we can analize in details those brand searches.
How to use them
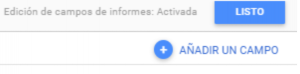
We must access to the data source and add a new field:
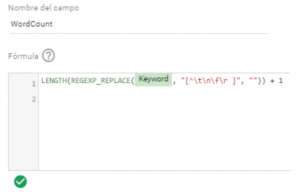
We can name this new field as we like. In the “Formula” field there are endless possibilities. Here are some examples:
- In order to count the number of words we can use this formula that combines LENGTH and REGEXP_REPLACE: LENGTH(REGEXP_REPLACE(Keyword, “[^\t\n\f\r ]”, “”)) + 1
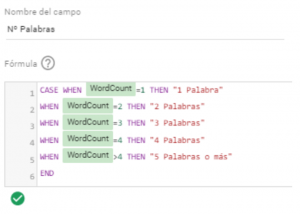
- In order to combine Search Console keywords according to the number of words, we will use the CASE function like this:
By clicking on this link you can check all functions that DataStudio can offer.